Final Results Received for 2020 and Preparation for 2021 Drill Program Underway
Vancouver, BC – April 13, 2021 – HighGold Mining Inc. (TSX-V:HIGH, OTCQX:HGGOF) (“HighGold” or the “Company”) is pleased to announce final assay results for an additional nine (9) holes and recap the highlights of the Company’s first full season of exploration drilling at its flagship 0.75 million ounce 10.9 g/t gold equivalent (“AuEq”) Johnson Tract polymetallic Gold Project (“Johnson Tract”, “JT” or the “Project”) in Southcentral Alaska, USA. The 2020 Drill Program (the “Program”) totaled 16,418 meters in 32 completed drill holes and all assays have been received. The Au-Cu-Zn-Ag-Pb mineralization associated with the JT Deposit has now been expanded to a total strike length of 500 meters (from 325 meters, based on previous step-out holes) and a down-plunge distance of 575 meters and remains open along strike to the northeast and southwest, and at depth.
The Company also announces that it will be mobilizing in mid May to conduct the fully-funded 2021 JT drill program.
Key JT Deposit 2020 Exploration Highlights
- JT Deposit mineralization extended 180m down-plunge and on strike of earlier reported step-out intersections with 7.9m at 2.0% Cu, 1.7% Zn, and 18 g/t Ag (2.9% CuEq) in hole JT20-111B
- The 2020 drill program successfully doubled the footprint of mineralization surrounding the JT Deposit mineral resource (see Figure 1)
- Exceptional results in previously reported step-outs on the margins of the JT Deposit mineral resource that yielded 74.1m at 23.8 g/t AuEq and 43.5m at 9.9 g/t AuEq in holes JT20-092 and JT20-093 (See HighGold press release dated September 9, 2020 for details)
- Emergence of the Footwall Copper Zone, a new zone of copper-silver rich mineralization that has now been intersected in seven (7) drill holes
- Mineralization expanded in multiple directions and remains open for expansion along strike to the northeast and southwest, and at depth – this is a break-through as the JT Deposit was previously thought to be constrained by a fault
- VMS mineralization identified 600m northeast and on trend from the JT Deposit (7.8m at 9.8% ZnEq in hole JT20-114) opening up a new style of mineralization and exploration potential at JT
- New advancements made in the understanding of Johnson Tract geology, including a revised fault offset target which has, as yet, been subject to little to no drill testing
- The discovery of strongly mineralized Cu-Au-Zn boulders, 200m up-valley from the JT Deposit, which highlights the potential to discover JT mineralization along newly defined mineralized corridor (see Figure 2)
“We are very pleased to see that the extent of the JT mineralized system is growing as we continue to step out northeast and down-plunge of the deposit,” commented President and CEO Darwin Green. “Focus will now turn to the upcoming 2021 field season in which we will be targeting both larger step-outs to the northeast and down-plunge with wide-spaced drilling for additional zones of high-grade gold and continued expansion of the JT Deposit. I am particularly encouraged by the new mineralization documented, 200 meters up-valley from the main JT Deposit, in what we call our Gap Target. Outside of the JT Deposit, we are set to drill the highly prospective DC target and rank a series of large areas of gold and silver mineralization (rock and soil geochemistry) that are prime targets for follow-up. There is much to be excited about as the 2021 drill season approaches.”
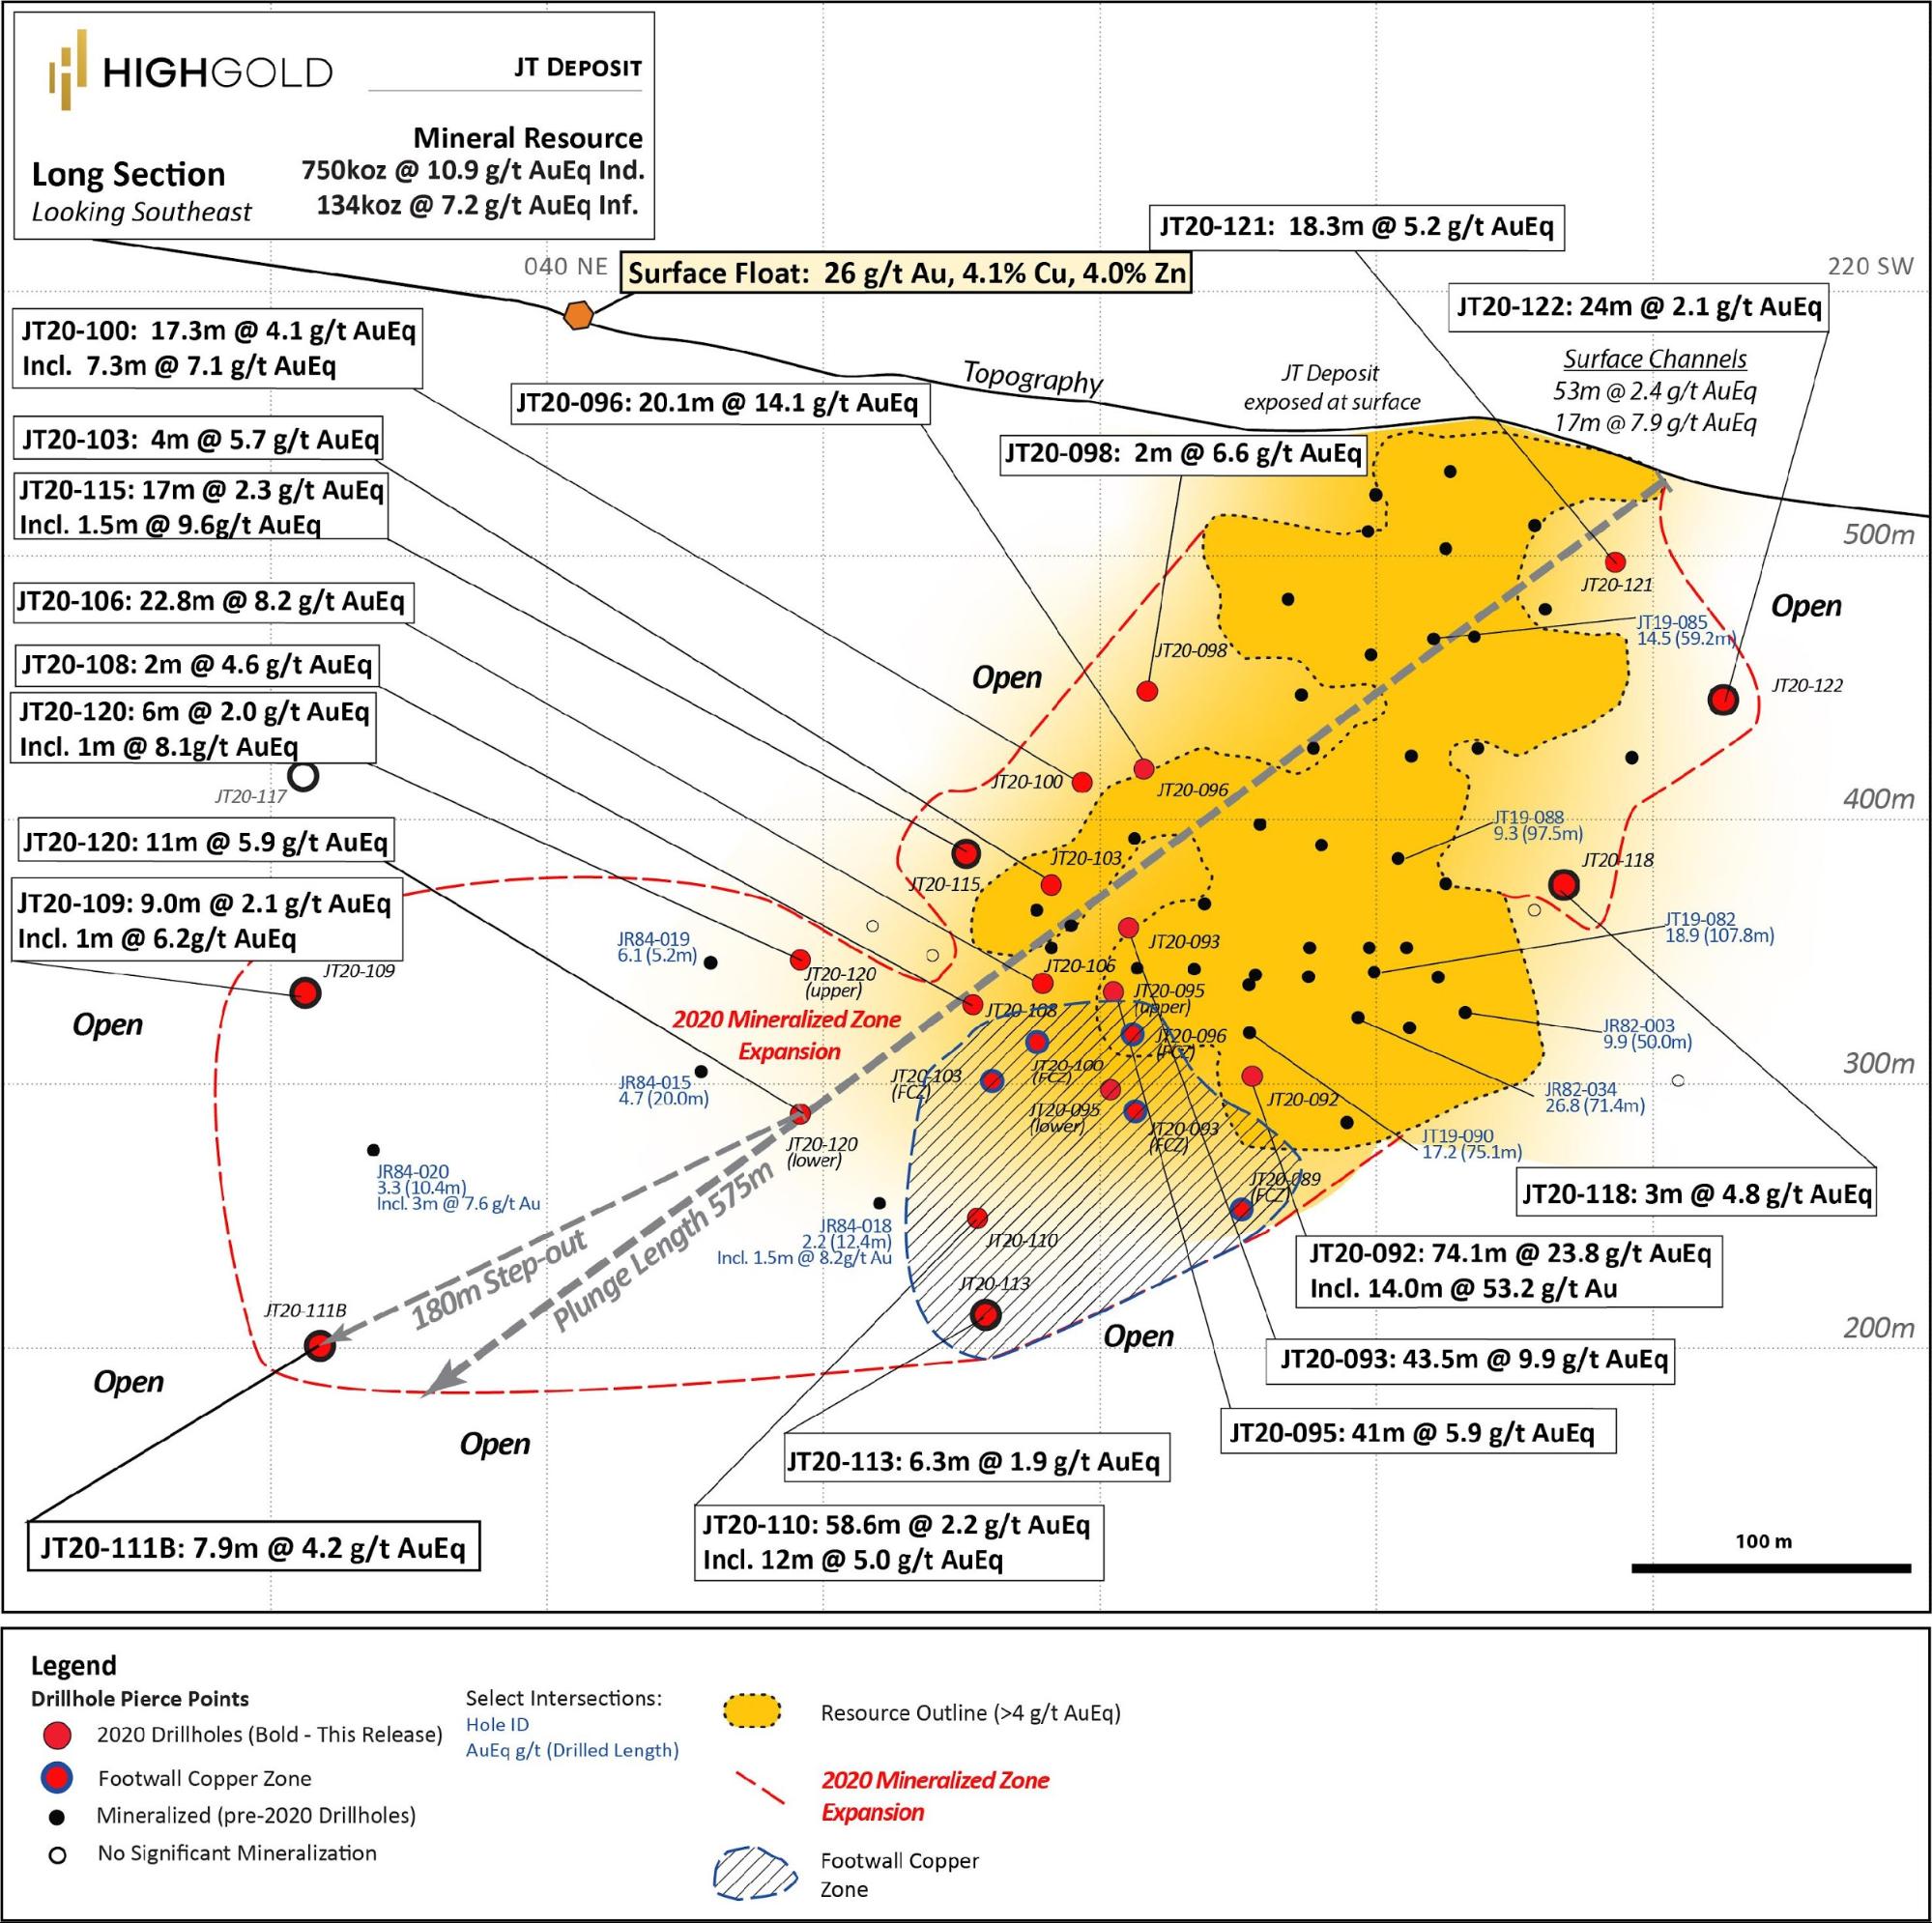
Figure 1. Johnson Tract Project – Longitudinal Section for JT Deposit with 2020 drill holes
Discussion of Current JT Deposit Expansion Results
Results reported today include intersections from expansion drilling at the JT Deposit (seven (7) holes) and the Northeast Offset Target (“NE Offset” or “NEO”) (two (2) holes). A complete list of significant assay intersections is presented in Table 1 with locations shown on a longitudinal section in Figure 1 and plan map in Figure 2.
The Company completed a cross-section of three (3) drill holes (JT20-109, JT20-111B, and JT20-117), 180 meters northeast and down-plunge of previously reported drill hole JT20-120 which returned 11 meters at 5.9 g/t AuEq (See HighGold press release dated January 21, 2021). Holes JT20-109 and 111B returned 7.9 to 11-meter widths of encouraging copper-zinc-gold-silver mineralization, including 7.9 meters at 4.2 g/t AuEq (2.9% CuEq). Combined with a lone historic drill intersection of 3 meters at 7.6 g/t gold (JR84-020) 80 meters up-dip of JT20-111B, these results extend mineralization approximately 250 meters beyond the northeast edge of the JT Deposit resource and highlight potential for additional resource growth. The mineralized zone expansion defined by the 2020 drill program remains open along strike to the northeast and southwest and down-plunge from the JT Deposit.
Hole JT20-117, which was drilled above the projected plunge of the JT Deposit at depth, returned no significant values. Hole JT20-111 was re-drilled as JT20-111B after it was lost at 344m before reaching target depth and the two holes are grouped herein as one.
The Company also reports the results from step-out drill holes around the margins of the JT Deposit. Four (4) drill holes (JT20-113B, JT20-115, JT20-118B, JT20-122) were completed as 25 to 30-meter step-outs and returned up to 56.1 meters at 2.0% Zn, 0.42 g/t Au, 0.3% Pb (3.1% ZnEq), including 1.5 meters at 6.5 g/t Au, 4.2% Zn, 0.4% Cu (9.6 g/t AuEq or 15.8% ZnEq), in hole JT20-115. Hole JT20-122 was drilled near surface at the southwest end of the JT Deposit and returned a long 24.0-meter interval of 2.8% Zn, including 11.5 meters at 3.8% Zn, 0.23 g/t Au (4.7% ZnEq) that is considered fringe mineralization.
Surface prospecting and sampling 200 meters northeast and upslope from the JT Deposit discovered a strongly clay-altered zone within a drainage system where a grab sample of a potential near-source mineralized boulder returned 26 g/t Au, 4.1% Cu, 4% Zn. The mineralized boulder has a distinct quartz vein stockwork and appears to be the same dacitic lithic tuff that hosts the JT Deposit. Further mapping and sampling in this exciting new area will be carried out in 2021. Grab samples, by their nature, are selective and not necessarily representative of the mineralization hosted on the property
Discussion of Final NE Offset Results
Results have been received from the final two (2) drill holes at the NE Offset target. Holes JT20-116 and 119 were drilled on the southernmost of three drill cross-sections completed at NEO but returned only weakly anomalous values over narrow widths. However, the geological information garnered from these holes supports the new defined structural corridor that runs from JT to NEO.
Significant new advancements have made in the understanding of Johnson Tract geology based on the 2020 drill program. This includes an updated and revised model for the offset target which has, as yet, been subject to little to no drill testing (see Figure 2). In addition, the discovery of VMS style mineralization in previously reported NEO drill hole JT20-114 (7.8m at 9.8% ZnEq) highlights the opportunity for other deposit types and further enhances the overall exploration potential for the Project.
Current Initiatives and 2021 Program
The Company continues to refine the geology and alteration 3D model for Johnson Tract. Focus for the 2021 Drill Program, in the main JT Deposit area, will include systematic step-outs along strike and down-plunge from the current modeled resource testing the 600-meter long Gap Target, the sparsely-drilled northeast-trending ‘prospective corridor’ between the JT Deposit and the original NEO target. Our updated exploration model identifies key areas east and south of the 2020 NEO drilling for the potential fault-displaced extensions of the JT Deposit. Amongst the targets outside of the JT Deposit area, the DC target will be a key focus. The program and budget will be announced in detail in late April.
Figure 2. Johnson Tract Project – 2020 Drill Hole Plan Map with JT Deposit and NE Offset Target
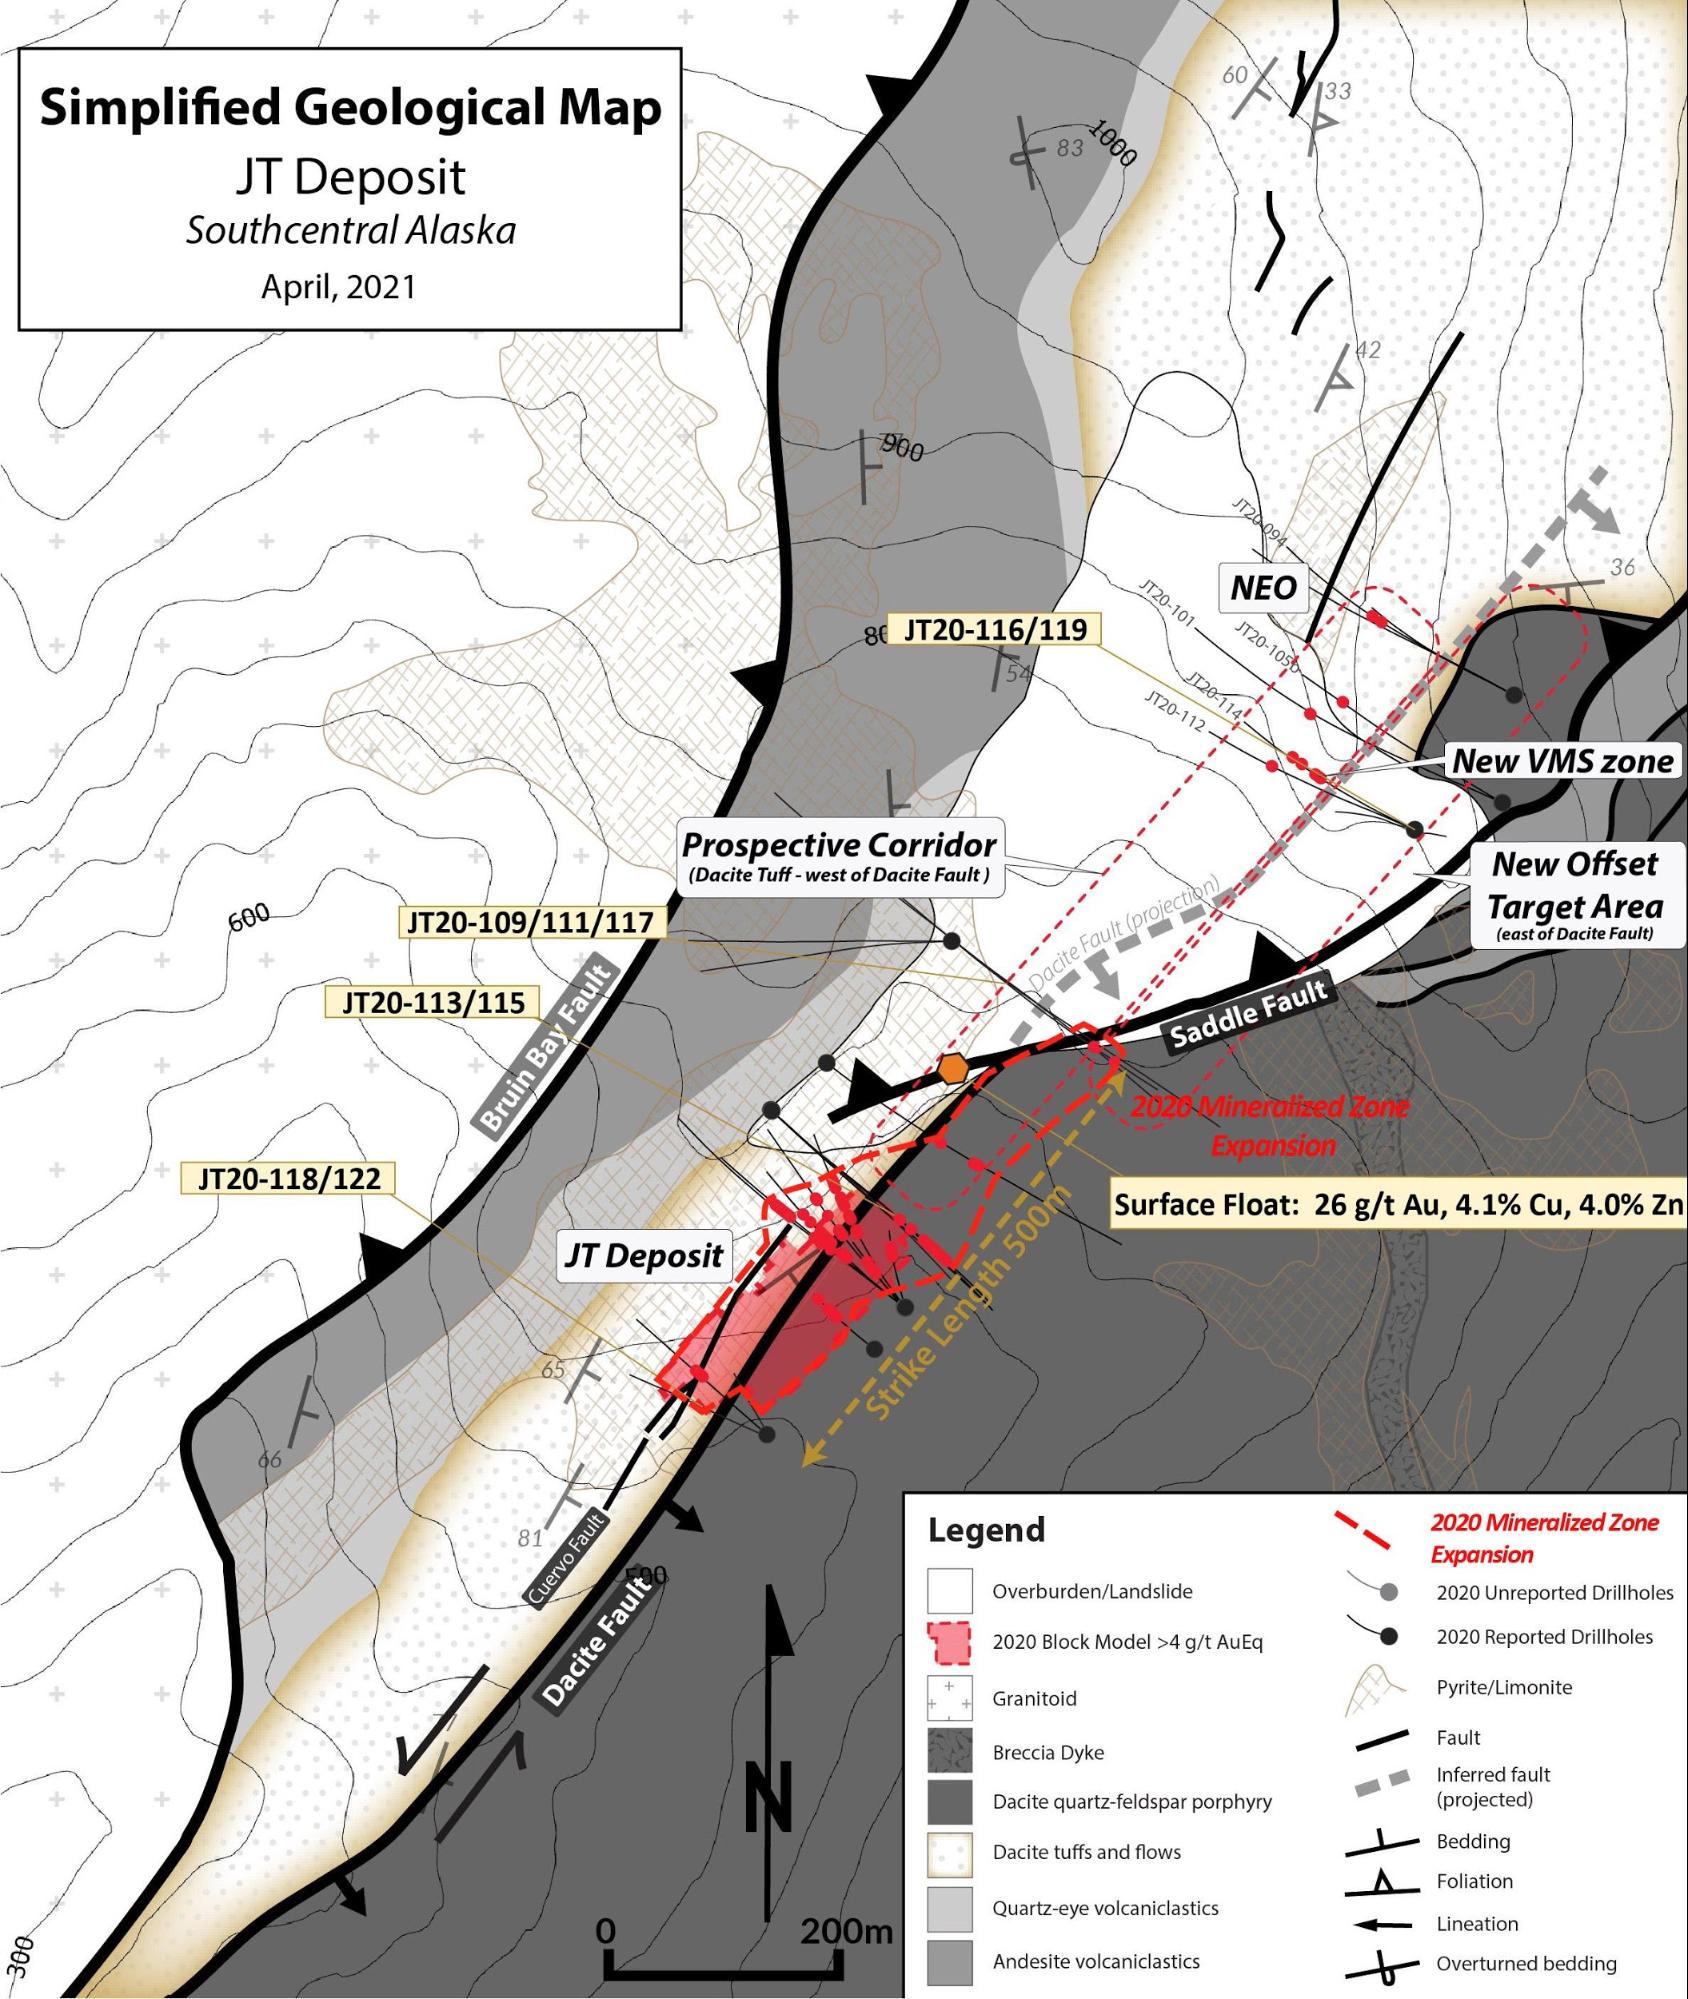
Table 1. Significant Johnson Tract drill intersections for final 9 holes of 2020 drill program
|
Drill Hole |
From |
To |
Length |
Zn |
Cu |
Pb |
Au |
Ag |
ZnEq |
AuEq |
|
(meters) |
(meters) |
(meters) |
% |
% |
% |
(g/t) |
(g/t) |
% |
(g/t) |
|
|
JT Deposit - Expansion |
||||||||||
|
JT20-109 |
292.10 |
301.10 |
9.00 |
1.58 |
0.14 |
0.49 |
0.63 |
2.0 |
3.39 |
2.1 |
|
Including |
292.10 |
293.10 |
1.00 |
4.07 |
0.49 |
0.11 |
2.89 |
3.2 |
4.78 |
6.2 |
|
JT20-111/ 111B |
283.90 |
285.90 |
2.00 |
6.79 |
0.35 |
0.55 |
0.02 |
2.9 |
4.97 |
5.0 |
|
Including |
283.90 |
284.90 |
1.00 |
8.97 |
0.30 |
0.08 |
0.02 |
1.7 |
5.98 |
6.0 |
|
And |
434.40 |
442.30 |
7.90 |
1.65 |
1.97 |
0.23 |
0.05 |
18.0 |
6.86 |
4.2 |
|
Including |
435.40 |
436.50 |
1.10 |
4.74 |
5.11 |
0.22 |
0.06 |
48.1 |
17.88 |
10.9 |
|
JT20-113B |
217.10 |
221.40 |
4.30 |
0.04 |
0.56 |
0.02 |
1.18 |
19.6 |
3.67 |
2.2 |
|
And |
279.20 |
288.20 |
9.00 |
0.09 |
1.33 |
0.01 |
0.12 |
18.7 |
3.75 |
2.3 |
|
And |
353.70 |
360.00 |
6.30 |
0.27 |
0.46 |
0.00 |
0.97 |
8.5 |
3.10 |
1.9 |
|
JT20-115 |
181.00 |
237.10 |
56.10 |
1.97 |
0.06 |
0.32 |
0.42 |
1.5 |
3.08 |
1.9 |
|
Including |
183.90 |
190.50 |
6.60 |
2.82 |
0.05 |
0.93 |
0.43 |
5.1 |
4.53 |
2.8 |
|
And Incl. |
196.50 |
201.80 |
5.30 |
2.91 |
0.02 |
0.73 |
0.08 |
1.1 |
3.72 |
2.3 |
|
And Incl. |
210.00 |
211.50 |
1.50 |
4.19 |
0.38 |
0.01 |
6.50 |
1.9 |
15.78 |
9.6 |
|
And Incl. |
220.10 |
237.10 |
17.00 |
2.56 |
0.07 |
0.40 |
0.40 |
1.3 |
3.75 |
2.3 |
|
And |
260.30 |
266.30 |
6.00 |
2.53 |
0.06 |
0.00 |
0.40 |
0.5 |
3.34 |
2.0 |
|
JT20-117 |
no significant assays |
|||||||||
|
JT20-118B |
201.60 |
204.60 |
3.00 |
5.84 |
0.13 |
1.68 |
0.06 |
13.3 |
7.89 |
4.8 |
|
And |
220.60 |
221.20 |
0.60 |
5.80 |
0.08 |
0.01 |
0.28 |
1.5 |
6.49 |
4.0 |
|
JT20-122 |
137.80 |
144.00 |
6.20 |
3.75 |
0.06 |
0.77 |
0.04 |
3.5 |
4.66 |
2.8 |
|
Including |
141.70 |
144.00 |
2.30 |
6.58 |
0.13 |
1.59 |
0.04 |
5.9 |
8.39 |
5.1 |
|
And |
154.20 |
178.20 |
24.00 |
2.81 |
0.06 |
0.19 |
0.14 |
5.3 |
3.44 |
2.1 |
|
Including |
163.50 |
175.00 |
11.50 |
3.84 |
0.10 |
0.15 |
0.23 |
8.4 |
4.73 |
2.9 |
|
NE Offset Target |
||||||||||
|
JT20-116 |
no significant assays |
|||||||||
|
JT20-119 |
no significant assays |
|||||||||
Notes: Estimated true thickness is from 60% to 90% of drilled length. Length-weighted intervals are uncapped and calculated based on a 2 g/t gold equivalent cut-off. Gold equivalent (“AuEq”), Zinc Equivalent (“ZnEq”) and Copper Equivalent (“CuEq”) is calculated by the same formula and assumptions used to report the JT Deposit NI43-101 Resource (effective date April 29, 2020) with metal prices of $1350/oz gold, $16/oz silver, $2.80/lb copper, $1.20/lb zinc, $1.00/lb lead and does not consider metal recoveries.
About the Johnson Tract Gold Project
Johnson Tract is a poly-metallic (gold, copper, zinc, silver, lead) project located near tidewater, 125 miles (200 kilometers) southwest of Anchorage, Alaska, USA. The 21,000-acre property includes the high-grade Johnson Tract Deposit (“JT Deposit”) and at least nine (9) other mineral prospects over a 12-kilometer strike length. HighGold acquired the Project through a lease agreement with Cook Inlet Region, Inc. (“CIRI”), one of 12 land-based Alaska Native regional corporations created by the Alaska Native Claims Settlement Act of 1971. CIRI is owned by more than 9,100 shareholders who are primarily of Alaska Native descent.
Mineralization at Johnson Tract occurs in Jurassic-age intermediate volcaniclastic rocks and is characterized as epithermal-type with submarine volcanogenic attributes. The JT Deposit is a thick, steeply dipping silicified body (20m to 50m average true thickness) that contains a stockwork of quartz-sulphide veinlets and brecciation, cutting through and surrounded by a widespread zone of anhydrite alteration. The Footwall Copper Zone is located structurally and stratigraphically below JT Deposit and is characterized by copper-silver rich mineralization.
The JT Deposit hosts an Indicated Resource of 2.14 Mt grading 10.93 g/t gold equivalent (“AuEq”) comprised of 6.07 g/t Au, 5.8 g/t Ag, 0.57% Cu, 0.80% Pb and 5.85% Zn. The Inferred Resource of 0.58 Mt grading 7.16 g/t AuEq is comprised of 2.05 g/t Au, 8.7 g/t Ag, 0.54% Cu, 0.33% Pb, and 6.67% Zn. For additional details see NI 43-101 Technical Report titled “Initial Mineral Resource Estimate for the Johnson Tract Project, Alaska” dated June 15, 2020 authored by James N. Gray, P.Geo of Advantage Geoservices Ltd and Brodie A. Sutherland, P.Geo. Gold Equivalent is based on assumed metal prices and 100% recovery and payabilities for Au, Ag, Cu, Pb, and Zn. Assumed metal prices for the Resource are US$1350/oz for gold (Au), US$16/oz for silver (Ag), US$2.80/lb for copper (Cu), US$1.00/lb for lead (Pb), and US$1.20/lb for zinc (Zn) and are based on nominal 3-year trailing averages as of April 1, 2020. Historical metallurgical testing on drill core samples has indicated that good gold and base metal recoveries and marketable concentrates can be expected.
Prior to HighGold, the Project was last explored in the mid-1990s by a mid-tier mining company that evaluated direct shipping material from Johnson to the Premier Mill near Stewart, British Columbia.
About HighGold
HighGold is a mineral exploration company focused on high-grade gold projects located in North America. HighGold’s flagship asset is the high-grade Johnson Tract Gold (Zn-Cu) Project located in accessible Southcentral Alaska, USA. The Company also controls a portfolio of quality gold projects in the greater Timmins gold camp, Ontario, Canada that includes the Munro-Croesus Gold property, which is renowned for its high-grade mineralization, and the large Golden Mile and Golden Perimeter properties. HighGold’s experienced Board and senior management team, are committed to creating shareholder value through the discovery process, careful allocation of capital, and environmentally/socially responsible mineral exploration.
Ian Cunningham-Dunlop, P.Eng., VP Exploration for HighGold Mining Inc. and a qualified person ("QP") as defined by Canadian National Instrument 43-101, has reviewed and approved the technical information contained in this release.
On Behalf of HighGold Mining Inc.
“Darwin Green”
President & CEO
For further information, please visit the HighGold Mining Inc. website at www.highgoldmining.com, or contact:
Darwin Green, President & CEO or Naomi Nemeth, VP Investor Relations
Phone: 1-604-629-1165 or North American toll-free 1-855-629-1165
Email: moc.gninimdloghgih@noitamrofni.
Website: www.highgoldmining.com
Twitter: @HighgoldMining
Additional notes:
Starting azimuth and dip (Azimuth/-Dip) for drill holes reported today are noted as follows: JT90-090Ext (306/-79), JT20-109 (130/-61), JT20-111 (130/-65), JT20-111B (130/-66), JT20-113B (130/-64), JT20-115 (130/-46), JT20-116 (295/-85), JT20-117 (130/-49), JT20-118B (335/-80), JT20-119 (115/-87), and JT20-122 (295/-48). Samples of drill core were cut by a diamond blade rock saw, with half of the cut core placed in individual sealed polyurethane bags and half placed back in the original core box for permanent storage. Sample lengths typically vary from a minimum 0.5 meter interval to a maximum 2.0 meter interval, with an average 1.0 to 1.5 meter sample length. Drill core samples are shipped by air and transport truck in sealed woven plastic bags to ALS Minerals sample preparation facility in Fairbanks, Alaska for sample preparation and from there by air to ALS Minerals laboratory facility in North Vancouver, BC for analysis. ALS Minerals operate according to the guidelines set out in ISO/IEC Guide 25. Gold is determined by fire-assay fusion of a 50 g sub-sample with atomic absorption spectroscopy (AAS). Samples that return values >100 ppm gold from fire assay and AAS are determined by using fire assay and a gravimetric finish. Various metals including silver, gold, copper, lead and zinc are analyzed by inductively-coupled plasma (ICP) atomic emission spectroscopy, following multi-acid digestion. The elements copper, lead and zinc are determined by ore grade assay for samples that return values >10,000 ppm by ICP analysis. Silver is determined by ore grade assay for samples that return >100 ppm.
The Company has a robust QAQC program that includes the insertion of blanks, standards and duplicates.
Neither TSX Venture Exchange nor its Regulation Services Provider (as that term is defined in the policies of the TSX Venture Exchange) accepts responsibility for the adequacy or accuracy of this release.
Forward looking statements: This news release includes certain “forward-looking information” within the meaning of Canadian securities legislation and "forward-looking statements" within the meaning of the United States Private Securities Litigation Reform Act of 1995 (collectively “forward looking statements”). Forward-looking statements include predictions, projections and forecasts and are often, but not always, identified by the use of words such as “seek”, “anticipate”, “believe”, “plan”, “estimate”, “forecast”, “expect”, “potential”, “project”, “target”, “schedule”, “budget” and “intend” and statements that an event or result “may”, “will”, “should”, “could” or “might” occur or be achieved and other similar expressions and includes the negatives thereof. All statements other than statements of historical fact included in this release, including, without limitation, statements regarding the Company’s currently ongoing drill program and pending assays are forward-looking statements that involve various risks and uncertainties. There can be no assurance that such statements will prove to be accurate and actual results and future events could differ materially from those anticipated in such statements. Forward-looking statements are based on a number of material factors and assumptions. Important factors that could cause actual results to differ materially from Company’s expectations include actual exploration results, changes in project parameters as plans continue to be refined, results of future resource estimates, future metal prices, availability of capital and financing on acceptable terms, general economic, market or business conditions, uninsured risks, regulatory changes, defects in title, availability of personnel, materials and equipment on a timely basis, accidents or equipment breakdowns, delays in receiving government approvals, unanticipated environmental impacts on operations and costs to remedy same, and other exploration or other risks detailed herein and from time to time in the filings made by the Company with securities regulators. Although the Company has attempted to identify important factors that could cause actual actions, events or results to differ from those described in forward-looking statements, there may be other factors that cause such actions, events or results to differ materially from those anticipated. There can be no assurance that forward-looking statements will prove to be accurate and accordingly readers are cautioned not to place undue reliance on forward-looking statements.